Update: 2 November 2013 - v1.3.1 HISCAM scales released (minor update with bug fix from v1.3)
Summary:
This page contains links for a project called 'HISCAM', which stands for 'historical CAMSIS'. We are concerned with using historical data resources obtained from marriage registers, family histories and census datasets, in order to analyse inter-generational patterns of occupational social associations, to derive CAMSIS scales for historical occupatonal records, using the HISCO occupational coding scheme.
The HISCAM project is an undertaking to estimate a series of alternative CAMSIS scales for HISCO coded occupational data. We use data from 7 countries covering the period 1800-1938: the Netherlands; Britain; Germany; France; Sweden; Canada; Belgium (we have also tried some estimations using data from the USA, but have not yet been able to achieve satisfactory results). We use the same scale estimation techniques as for the contemporary versions of the CAMSIS project. The main intention is to generate occupation-based stratification measures suitable to these countries and time periods. This can be done in a few different ways, which include evaluations of the differences between occupational locations from different countries and time periods.
We summarise the HISCAM project in our 2013 article in Historical Methods.
This page is primarily used to distribute selected data files associated with the project. Some article format references on HIS-CAM are described here. Other outputs associated with our work are also distributed via the HISCO project webpages.
Download our scales!
HISCAM VERSION 1.3.1 (NOVEMBER 2013)
Version Stata SPSS MS Excel Tab delimited Details (Stata format)Universal scales (derived from data from multiple countries)
U1: Male and female,1800-1938
U2: Male only,1800-1938 U3: Female only,1800-1938 E: Early period, 1800-c1890 L: Later period, c1890-1938National scales (derived from data for a single country, males only, 1800-1938)
NL: Netherlands DE: Germany* FR: France SE: Sweden* GB: Britain CA: Canada BE: Belgium* The scales for Germany and Sweden are based on relatively small samples and may be less reliable. For these countries, using the universal scale may be preferable. Combined file (all versions)
Citation note:
If you use HISCAM, please take care to clarify the version of the scale that you used, and please can we ask you to cite one of the relevant articles on the scale (at time of writing, our 2013 article in Historical Methods is probably the most appropirate)
We recommend that when you use a HISCAM scale you should refer to its version number and type. We suggest using the scale labels indicated above in combination with the version number. Some good examples might be "Figure 16 uses the HIS-CAM scale (version 1.3.1.U1)" and "correlations using HIS-CAM for Canada (version 1.3.1.CA, accessed December 2013 from http://www.camsis.stir.ac.uk/hiscam/)".
If you're a Stata user, you can open the Stata or .dat files directly from this site, e.g. use http://www.camsis.stir.ac.uk/hiscam/v1_3_1/hiscam_nl.dta, clear
If you're not a Stata user but want to access one of the Stata format files, consider using 'get stata file' in SPSS, or read.dta under library(foreign) in R.
Finally, on terminology, in the recent past we have sometimes referred to our project as 'HISCAM' and sometimes as 'HIS-CAM'. On balance we prefer 'HISCAM', but we won't hold it against you if you use the hyphenated version!
Version history:
v0.1 published May 2006 (http://www.camsis.stir.ac.uk/hiscam/v01/) v0.2 published Feb 2008 (http://www.camsis.stir.ac.uk/hiscam/v02/) v1.0 published Sep 2009 (http://www.camsis.stir.ac.uk/hiscam/v1_0/)
v1.1 published Oct 2009 (http://www.camsis.stir.ac.uk/hiscam/v1_1) v1.2 published Nov 2010 (http://www.camsis.stir.ac.uk/hiscam/v1_2) v1.3 published Feb 2011 (http://www.camsis.stir.ac.uk/hiscam/v1_3) v1.3.1 published Nov 2013 (minor bug fix to v1.3, removing up to 14 erroneous HISCO codes, no change to all other scores) (http://www.camsis.stir.ac.uk/hiscam/v1_3_1)
Recommended cited references for HISCAM:
Lambert, P. S., Zijdeman, R. L., Maas, I., van Leeuwen, M. H. D., & Prandy, K. (2013). The construction of HISCAM: A stratification scale based on social interactions for historical research. Historical Methods, 46(2), 77-89. DOI:10.1080/01615440.2012.715569
Zijdeman, R.L. and Lambert, P.S. (2010) "Measuring social structure in the past: A comparison of historical class schemes and occupational stratification scales on Dutch 19th and early 20th century data". Belgian Review of Contemporary History, 40(1), 1111-1141.
Lambert, P.S., Zijdeman, R.L., Maas, I., Prandy, K., and van Leeuwen, M.H.D. (2008) "HIS-CAM - Presentation and evaluation of an historical occupational stratificaton scale based upon the analysis of social interaction." Paper presented to the European Social Science History conference, Lisbon, 26 February - 1 March 2008 . (presentation slides [powerpoint] [pdf]).
Lambert, P.S., Zijdeman, R.L., Maas, I., Prandy, K., and van Leeuwen, M.H.D. (2006) "Testing the universality of historical occupational stratification structures across time and space." Paper presented to the ISA RC 28 Social Stratification and Mobility spring meeting, Nijmegen, 11-14th May 2006. (Download this paper: draft version of 5th May 2006 [pdf]; presentation slides [powerpoint] ).
Maas, I., Lambert, P.S., Zijdeman, R.L., Prandy, K. and van Leeuwen, M.H.D. (2006) “HIS-CAM - The derivation then implementation of an historical occupational stratification scale.” Paper presented to the Sixth European Social Science History Conference, RAI, Amsterdam, 22-25 March 2006
Comments and questions:
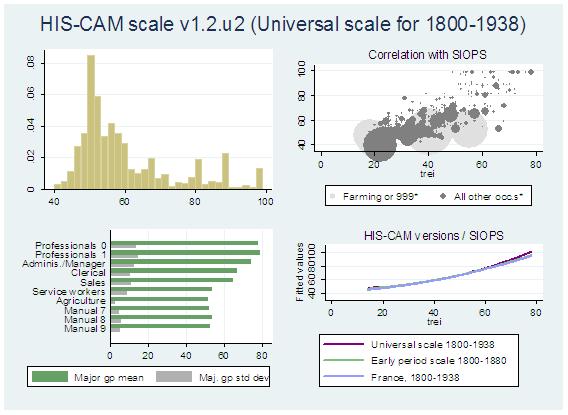
Q: Where have these scales come from?
A: We've made these scales by applying the CAMSIS methodology to data on inter-generational occupational pairs from 7 countries. The end product is a social interaction distance scale defined according to patterns of inter-generational occuaptional connections.
Q: What is it that the scale scores for occupations indicate?
A: Position within the social stratification structure of people holding those occupations.
More precisely, they show our empirical estimate of the average relative position within the structure of social stratification occupied by the incumbents of occupational unit groups. These estimates are calculated according to our analysis of observed patterns of social interaction between the incumbents of those occupations, being derived by identifying a dimensional structure to social interaction patterns which reflects the structure of social stratification and inequality. Some people refer to the structure measured by HIS-CAM/CAMSIS scales as a structure of 'status', 'prestige', 'socio-economic position', or 'class'. We prefer the term 'stratification position', because other terms have ambiguous alternative uses.
Q: Why are there multiple scales, and which one should I use?
A: If you're unsure, we would suggest you stick with the universal scale for men only ('U2'), or the universal scale for all adults ('U1') if your data features many female occupational codes. .
The social meaning of having an occupation could well be different in different contexts (e.g. different time periods). Most sociologists and social historians believe that by and large, the relative advantage associated with occupations is quite stable over time, but that there are some deviations from those patterns, particularly associated with transformations over time in the scale of the agricultural sector and in female employment patterns.
Because HISCAM scales are empirical estimates, there are in principle few limits to how many different scales we might produce - for different countries, time periods, men and women, etc. During the HISCAM project we have in fact produced many thousands of different scales, but you don't want to know about those. In version 1.1, we've distributed 13 different scales which we think are especially useful to understanding occupational stratification over the period 1800-1938.
If you are working on a particular country, looking at the national scale for that country is likely to be of interest, but even then you might find that using the universal scale seems more reliable or consistent for comparative purposes. Also, at the time of publication of version 1.1, we have published scales for two countries, Germany and Sweden, based upon relatively small sample sizes, and we have some doubts about the reliability of the scales for those particular countries
Q: A score of 65 for a blast furnaceman? I don't think that's right?
A: There are two factors which might lie behind a counter-intuitive scale score.
Firstly, our scales are empirical estimates of the average social position held by the incumbents of occupations. The objective qualities of an occupation have no direct input to the calculation of a HIS-CAM scale score. It is conceivable that an occupation which we would, objectively, think of as relatively disadvantaged (e.g. blast furnaceman) is in fact typically held, in the society we are analysing, by individuals who enjoy relatively advantaged social positions (a score of 65 is one standard deviation above the mean). This sort of pattern does in fact often arise in societies in the nineteenth century, since the average position may be unduly dominated by disadvantaged agricultural jobs, leaving everybody else in a position of relative advantage (to agricultural labourers).
Secondly, our scales are subject to sampling error. We take some steps to minimise the danger that a paricular occupation has a score which isn't really a good indication of its typical social position, but we can't eliminate the possibility. The scales based on larger samples of records (the Universal scales, and the national scales for the Netherlands, Britain and Belgium) should generally have the lowest degree of estimation errors.
Q: What scale are the HIS-CAM scores actually on?
A: All the scales that we release have been mean standardised to a mean of 50 and standard deviation of 15 on the sample for which our analysis was based. They are also 'cropped' as extreme values so that the minimum value is 1, and the maximum value is 99. The mean standardisation can be confusion becuase different scales may well seem to have very different values - this typically arises due to variations in the relative position accorded to occupations in the large agricultural sector, and to variations in the underlying population structure (of countries and samples). For comparative research, it is sensible to mean-standardise again, within the population groups that you are working on.
Q: Isn't it biassed to estimate occupational scales using inter-generational patterns, then use the same measures in order to assess inter-generational mobility trends?
A: No, it's not!
It can seem this might be the case, but the scale scores are being attributed to the occupational positions, then those attributes later analysed in other contexts. It is conceivable that this could lead to collinearity bias, if occupations perfectly predicted social mobility, but because they don't there is no statistical problem. For a non-statistical justification, imagine if a second set of occupational scales had been derived by measuring some other property (e.g. prestige), and the two sets of scales were perfectly or almost perfectly correlated (as indeed is typically the case). Would there be a problem with the first scale but not the second, even though they measure the same thing?
Other resources:
[CAMSIS home]
The project benefits from funding from an NWO research grant obtained by Marco van Leeuwen.
Principal Investigator: - Marco van Leeuwen Department of Sociology, University of Utrecht m.h.d.vanleeuwen@uu.nl Other project partners: - Paul Lambert Applied Social Science, University of Stirling paul.lambert@stirling.ac.uk - Ken Prandy Cardiff School of Social Sciences, Cardiff University - Ineke Maas Department of Sociology, University of Utrecht i.maas@uu.nl - Richard Zijdeman Department of Sociology, University of Utrecht R.L.Zijdeman@uu.nl