
Accessing and using CAMSIS scale scores
| INTRODUCTION | BIBLIOGRAPHIC REVIEW | SCALE CONSTRUCTION |
This page gives a brief guide to how the downloadable CAMSIS 'index' files may be used to access data on national versions of CAMSIS scales, then match with other data sets. Similar guides are also usually included in the 'readme' files in each of the national versions' downloadable archives.
- Overview
- Understanding the CAMSIS scales
- Occupational index units and files
- Matching to data files
- Gender groups
- Implications of pseudo-diagonals
- Major and Minor group averages
- Finer detail on the CAMSIS values
Understanding the CAMSIS scales
The CAMSIS scale scores are usually interpreted as representing an occupational unit's relative position within the national order of social interaction and stratification (or, more precisely, the average relative position held by the incumbents of the occupatonal unit). Those scores are derived, separately, for a number of different 'versions'. Different versions exist for different countries, different time periods, and for different occupational base unit schemes within a country. It is also a standard outcome of the methods used that different scores are obtained for men and women. (See also the notes on the construction of the scale scores.)
The CAMSIS scores supplied for each version are re-scaled representations of the 'raw' scores generated by 'RC' association models applied to patterns of social interaction between occupational units. We try to use the same re-scaling parameters for every CAMSIS version, namely that a nationally representative population's distribution of scale scores should have a mean of 50 and standard deviation of 15. Higher scores reflect, in our interpretation, greater advantage along the stratification dimension. Additionally, we impose the constraint that all rescaled scores which would fall outside the range 1-99 are 'cropped', to a minimum value of 1 and maximum value of 99. (In practice this constraint affects very few occupational unit scores, though specific notes are included in the downloadable version specific reports when relevant.) Although, to reiterate, the CAMSIS scores reflect only the differentiation of occupational units within a specific version, this re-scaling does leave the scores with some comparability between versions, namely that scores between versions all represent the same order of distance from the version specific mean. This property is especially relevant in the comparison of scale scores between gender groups, as discussed below.
In the first instance, many researchers may be interested in a descriptive review of the qualitative structure of the CAMSIS scores for the version relevant to them. This is most easily done by looking at the ranked order of occupational units by their within-gender CAMSIS scale scores. In a few cases, such tables are provided on these web pages (see the 'further details' links from the versions page), or it should be a fairly simple matter to sort the SPSS, Stata or Excel versions of the downloadable index files by scale score. (Take care, when sorting in Excel, to ensure that all columns of a relevant table are sorted together.) (Using SPSS, switching on the 'view value labels' option will usually show the text labels for each occupational unit; you may need, however, to sort back to the original order before attempting to match files - see below).

Occupational index units
In addition to occupation, strictly defined, many countries collect information on employment status, for example, whether someone is self-employed or an employee. Differences in employment status of this kind could be regarded as, in effect, defining different occupations, and this is how they are treated in CAMSIS. There is a fuller discussion of this issue in a separate note on Employment status. The tables of scores allow users to make use of more and less detailed employment status categories, including one for no information, that is, an occupational title only.
It is possible for users to match their data with appropriate CAMSIS scores using information on occupational title alone, or, if relevant, occupational title in combination with employment status. The occupational title variable should be numerically equivalent to the occupational title units used for the relevant CAMSIS version (which will be described on the country specific pages linked from the 'national versions' web page). If it is relevant for the particular country, an employment status variable will also be needed. If there is no information on employment status, this can usually be set to '0' (conventionally used here as an indicitor of 'unknown employment status'). Where employment status is known, it will be necessary to match the numeric schema described in the relevant sections of the country specific pages accessed from the 'national versions' web page. It will probably be simplest to edit the codes on the downloadable file to match those of the user's data (reference to the Employment status web page should also help in this). Coding the employment status indicator may require cross-classifying information from more than one source variable. (Normally, users should take care to code as 'not known' (0) any cases where employment status situation as defined in the CAMSIS scheme is not completely clear.
The occupational index files supplied should have a unique record for each possible combination of occupational title "occ" and, if relevant, employment status "empst". Associated with each are ordinarily the relevant CAMSIS scale scores for men "mcamsis" and women "fcamsis". Sometimes the index files also feature other information, such as dimension 2 scores, standard errors for the scores, mixed gender scores, diagnostic data about the scales and about specific occupations, or other occupation-based social classifications which have been added for convenience.
A common way of dealing with the different scores for men and women is first to set a variable, say "camscor" equal to "mcamsis", then to change the value to equal "fcamsis" where the respondent is female. (There may be situations, though, where it is thought desirable to retain both values for both occupations. In particular, it could be argued that it would be more appropriate to assign the male score to women's occupations if men and women are being compared as to the 'desirability' of their occupational locations - see below.)
Although we recommend using the fine detail of any occupational classification whenever possible, there are situations where data are only available at a more aggregate level, coded, say, into minor or even just major group. Where appropriate, the index files include scores for groups at these higher levels of aggregation. (For more details, see below.)
Matching to data files
The CAMSIS index files are usually available in Stata and SPSS format, as Excel worksheets, or as ASCII files. In order to link CAMSIS scores to your own datasets (e.g. to add them to a file with your own survey data which features a variable with the relevant occupational unit group), you will usually need to run an automated 'file-matching' procedure. If you are new to this approach, file-matching can be a difficult exercise, and for instance it is not taught routinely on introductory data analysis courses. An extended introduction to matching data between files, written by the same authors at the CAMSIS project, can be found on the DAMES project wepbages' guide to 'Help and standards of good practice in survey data management'.
SPSS instructions
Within SPSS, it is possible to link files between the users own data and the CAMSIS index file. Firstly, the CAMSIS file should be sorted by the occupational and employment status variables which will be used, and, for simplicity, only the relevant employment status variable retained. (When released, the files are usually sorted by one of the two employment status variables already, but this step is worth taking just in case it is not the variable which will be used). The example below, which works by making then using a temporary matching file which has no other purpose, would apply to users of the USA 1990 CAMSIS index for ISCO88 occupational classifications, if, given their dataset, they chose to work with the US 1990 specific employment status variable (as specified in our notes on the US 1990 version) :
get file="us90isco88.sav".
sort cases by isco88 (a) usempst (a) .
sav out="mtch1.sav" /keep=isco88 usempst mcamsis fcamsis.
Then, assuming that the user has a data set in which each record has one or more variables relating to occupation (e.g. respondent's present job, previous job, spouse's job, father's job), the index file functions as a look-up table using the SPSS Merge files/Add variables function. Assuming two variables "hocc" and "hempst" relating to a particular occupation with the appropriate numeric values (in our example, the hocc is an ISCO88 unit, and hempst a US 1990 employment status value), all that is needed is, first, to sort by "hocc" and "hempst", then to match with the index file:
sort cases by hocc (a) hempst (a).
match files /file=* /table='mtch1.sav'
/rename isco88=hocc usempst=hempst /by= hocc hempst .
execute.
Remember that for each occupational variable for which CAMSIS scores are being added the file will have to be re-sorted. Remember, also, that for those countries where employment status is not included (or where it is included but in categories which cannot be compared with any of the variables on the CAMSIS index files) an arbitary employment status value of 0 (for 'unknown') should be calculated and used as the employment status index variable.
Note: SPSS syntax v's windows menus options SPSS procedures like that described above are best undertaken using 'syntax' files, where the commands used can be written out, saved, and later repeated or indeed corrected. Users new to working with SPSS syntax can find introductory instructions on the SPSS help menu under 'syntax'. The same methods can, however, be achieved through the SPSS windows menus, for those who prefer to waste time unnecessarily before later loosing track of their work and / or their data files. Sorting the data file in ascending order of variables is achieved in SPSS 11 windows menus by switching to the data editor window then using 'Data' -> 'Sort cases..' then inserting the appropriate variables into the 'sort by' window, checking the 'ascending' box then clicking 'ok'. Interim files are opened and saved using the 'file'->'open'->'data' and 'file' -> 'save as' options and entering the appropriate file names before clicking 'ok'. File matching procedures are accessed under the data editor window as 'Data' -> 'Merge files' -> 'Add variables', where the appropriate file name must be located and entered, then, after clicking 'open', the key matching variables to be renamed (isco88 and usempst in the example above) must be pasted into the 'excluded variables' box and 'rename' applied to each typing in the name of the users variables. Then, the checkbox for 'match cases on key variables in sorted files' must be clicked as well as the checkbox for 'External file is keyed table', before the two rename variables in the 'excluded variables' must be highlighted and moved using the arrow shaped key into the box marked 'key variables'. Then click 'ok' and then 'ok' again after a warning is given over the need to sort data, before also choosing whether or not to save your currently open file before attempting the match.
Gender groups
It is important to remember that the CAMSIS scales are derived within the context of gender groupings; the male scales represent the ranking of males' occupations in a hierarchy of social interaction, and the female scales a ranking of females' occupations. Thus, for example, there is no necessary relationship between the values of an occupation on its male and female scales (although they are likely to share similar relative locations).
An implication is that the analysis of social stratification through occupations graded by the CAMSIS measure is ideally appropriate only within gender groups. Indeed, it is a little misleading, albeit a commonly made mistake, to analyse a mixed gender population through CAMSIS scores which are the male scale scores for the men and the female scale scores for the women. The occupational scale indexing used for men and women is invariably the same, further giving the impression of equivalent meanings. However the CAMSIS methodology assumes different systems of relative positions prevail within the male and female occupational structures, and hence implicitly that equivalent titles are not necessarily the same between genders.
There are however two data arrangements where, if the use of a mixed gender population is a substantive priority, use of CAMSIS scale scores for that population can be supported. If either are adopted, we would also recommend that researchers using modeling techniques consider terms which represent the interaction between the CAMSIS scale values and gender, since the patterns associated with such terms may shed light on the relative influence of gender differences.
Firstly, it may be plausible to represent the occupational position of both men and women through their scores on the scale derived solely for male occupations. This position would represent a 'conventional' view on occupational locations, that among the working population the advantages of occupations for all workers follow the hierarchy of the predominantly full-time, lifelong career, male occupational structure. Such an approach has been used by, for instance, Blackburn et al 1997.
Secondly, an alternative account would note the fact that we have re-scaled all CAMSIS scores within versions to have the same mean and standard deviations. Because of this, male and female scores have some equivalence, in that they represent each occupation's average position with respect to the population of men for men, and women for women. Because of this, the CAMSIS scale representation alluded to above, namely the commonly used attribution of male scores for men and female scores for women, whilst imperfect, is defensible.
Implications of Pseudo diagonals
As detailed in the page covering CAMSIS scale construction, in almost all versions we treat a number of husband-wife occupational combinations as 'diagonals' or 'pseudo-diagonals' (that is, as combinations which we consider occur much more often than would be expected them to from their respective general locations in an order of social interaction / stratification, for some identifiable, but relatively trivial, economic or institutional reason). For the majority of occupational units analysed, the proportion of cases within that unit which are excluded on the grounds of being a pseudo-diagonal are relatively small, for instance less than 1% of all cases representing the unit. However, it is also typically the case that for a small number of distinctive occupations, many cases, indeed the majority of cases from that occupational unit, are excluded as being pseudo-diagonals.
This issue is perhaps best illustrated by comparing two examples. In many versions, two specific pseudo-diagonal combinations are those where husband 'farmers' are married to wife 'agricultural workers', and those where husband 'doctors' are married to wife 'nurses'. In both cases, by treating the combination as a pseudo-diagonal we effectively remove its ability to influence the general scale score location assigned to each occupation. For the latter example, we therefore evaluate the position of male doctors from the pattern of their wives' occupations, excluding those cases where their wives are nurses, and we evaluate the position of female nurses from the patterns of the husbands' occupations, but excluding those cases where their husbands are doctors. In this example, as indeed is the case with most pseudo-diagonals used in the scale construction, only a small proportion of the wives of doctors or the husbands of nurses are excluded, and therefore we are reasonably confident that the occupational units remain sensibly represented.
However, in rarer cases, such as the former example, when we exclude from the evaluation of male farmers all cases where their wives are agricultural workers, and exclude from the evaluation of female agricultural workers all cases where their husbands are farmers, we actually exclude a high proportion of cases from each occupational unit. In such circumstances we are less confident that the two occupations have been appropriately represented in our scale derivation.
The issue is significant because our treatment of pseudo-diagonals implies a theoretical position that, whilst a general structure of social interaction (and stratification) between occupational units exists, it is overlain by more specific structures of social interaction which are determined by economic and institutional factors. This implies that all individuals in marital combinations determined by such 'pseudo-diagonal' reasons are distinguished from those in combinations determined by the general structure of interaction / stratification, and therefore their occupational location has (or at least could have) a different meaning for their interaction / stratification position than does the occupational location of a non-pseudo-diagonal individual. For instance, the occupation of a female agricultural worker means, or could mean, something different about her general stratification position if her husband is or is not a farmer. At present, the derived CAMSIS unit scores tell us only about the relative location of occupations whose incumbents are not part of pseudo-diagonal combinations, and moreover only define that location within the structure of closeness or distance to other, non-pseudo-diagonal, occupational combinations.
A solution in principle, therefore, would recommend that separate scale scores be assigned to individuals' occupations depending on whether or not their partner's occupation places them in a pseudo-diagonal. One possibility would be the ad hoc identification and reassignment of score values - for the example quoted above, for instance, we may choose to assign to female agricultural workers whose husbands are farmers, the derived CAMSIS score of female farmers, rather than that of female agricultural workers. However, such ad hoc solutions are difficult to implement consistently when applied to a wide range of other data sets.
An alternative method could involve re-specification of the RC model estimation with some sort of structure which treats the members of pseudo-diagonal and non-pseudo-diagonal combinations separately, but still assigns a score to those occupations which are part of pseudo-diagonal structures. It is conceivable that this could be achieved by a set of subsidiary dimension structures which include constraints on pseudo-diagonal structures, or through the use of 'grouping' specifications on the basic model. However, at the time of preparing these notes, no such ready solution has been apparent!
Thus our preferred solution is to assign the scale score derived for the non-pseudo-diagonal cases from an occupational unit, to all cases with that unit, whether they are part of pseudo-diagonal combinations or not. Subsequently, in the most extreme examples (such as male farmers and female agricultural workers), we add a caveat explaining the use of pseudo-diagonals relevant to a particular version, though for practical reasons we try to keep the number of such examples to a minimum. Thus we suggest that in most cases (such as the scaling of male doctors and female nurses), this treatment of occupational unit gradings is not misleading (whilst the possible extra influence of pseudo-diagonal combinations could be identified anyway in a subsequent analysis if information on the spouse was also available). Then, for the limited number of extreme examples, we specifically identify the relevant husband-wife combinations in the version specific notes provided, and make comments on the potentially misleading nature of the scores (again suggesting that if information on the spouse is available we could consider adjusting the model.)
Thus, the version specific notes available on the country specific web pages and through the relevant downloadable files (both accessed via the versions page) contain comments which identify those occupational combinations where the impact of excluding pseudo-diagonal combinations is anticipated to be non-trivial. Primarily for those most interested in methodological details, we also provide within the downloadable files a list of all occupational combinations which were treated as pseudo-diagonals for that particular version, although because the number is typically quite high (more than 300 is common), we do not recommend that most users try to make use of this information.
Major and Minor group averages
It is often the case that occupational title unit information is incomplete, and it can therefore be useful to know the average CAMSIS scale scores for relevant occupational 'major', 'sub-major' or 'minor' groupings. (In most countries, the basic occupational classification of title units is divided into nested subgroups of occupations, typically referred to as minor groups (the next in order above the unit groups), then 'sub-major' groups, then major groups.)
Many of the occupational index files available via the "versions" page include variables indicating group averages from the original CAMSIS data set. Where relevant, average scores for the cross-classification of these groups with the employment status variable are given. As with detailed occupational data, setting the employment status variable as '0' is equivalent to treating it as missing. The most appropriate calculation of such averages is to use the basic CAMSIS scores, simply calculating a mean of the scores of the sub-groups making up the aggregate group, each weighted by the number of cases in the sub-group.
Finer detail on the CAMSIS values
The downloadable index files are created with every effort to simplify the use of the CAMSIS occupational scales. The following section outlines a number of issues relating to the details of scale construction of which users should at least be aware. There are further complexities in the process of scale development which are not discussed at length in these web pages and files, but which may be of relevance to methodological investigations. Additional files with further details are available and interested users are welcome to contact us for further discussion.
- Merged occupations / Distributed occupational scores
- Imputed Values
- Proportion of 'excluded' cases
- Scaling of values
- Subsidiary dimensions
- Other Explanatory factors
- The non-working population
- 1) Merged occupations and distributed occupational scores
As detailed on the "construction" pages, a first step in all version constructions is the revision of occupational unit data in the event of any particular occupational unit being sparsely represented in the data source used. When such units are identified, we typically merge them with another occupational title which has very similar properties, or in the case of the title-by-status units we may merge categories within an occupational title which originally had different employment status categories (we conduct such mergers based upon both empirical and substantive evidence about the similarity of the occupational units: see the details on the "construction" pages).
The index files supplied therefore include occupational base units for which scale values were actually estimated on the combination of cases from more than one unit; that is the estimated scale scores are allocated to all the occupational units which contributed cases to them.
This practice could in certain circumstances be misleading. First, there is an asymmetric tendency of 'regression towards the mean'; base units which were sparsely represented will be pushed into merged groups with their neighbouring units and hence pushed towards average locations, whilst base units which were better represented will be capable of maintaining substantial differences from their neighbouring units. Secondly, since there is no automated consistency to the way occupational units are merged, it is possible that some merges will de-emphasise differences of one nature (for example employment status if the merges are within occupational titles between status groups), whilst other merges will de-emphasise other types of difference (for instance between occupational units if the merges are within status groups between titles). Our reviews of ongoing results from the CAMSIS scale constructions suggest that there is little evidence of these problems occurring markedly, but the possibility remains in the versions produced here. It should be noted, in any case, that the fact that the problem derives from there being sparse groups, it applies, by definition, to relatively few cases.
A more rigorous alternative method could conceivably be used to maintain appropriate differences between those occupational units which were merged due to sparsity problems. By examining the scores assigned to occupational units which were not merged with any other groups, it is possible to calculate a vast array of ratios which show the average differences between, for example, different status groups within an occupational minor group, or different title-by-status groups within a minor-by-status group. In turn, when distributing the scores from the merged unit to their original contributing units, it may be possible to use such ratios to adjust the different contributing units proportionately; for example, if within one occupation we had merged the status groups 2 and 3, but we know that on average within the minor group of that occupation, status group 2 occupations had scores 20% higher than those at status group 3, then we could adjust the distributed values in line with that ratio. However, this is a very complex method to implement thoroughly, whilst existing evidence suggests that the difference it would make to the readjusted distributed scores is empirically small. Since we also wish to make the CAMSIS scale construction as easily reproducible as possible, we therefore do not implement such readjusting procedures.
(back to 'finer details' / top)
- 2) Imputed values
The index files cover every occupational base unit possible in the given title-only or title-by-status schema. However, in most versions these include some theoretically possible units which were not represented in the data resource by any cases at all. (This is particularly common in versions using the title-by-status base unit, where certain status situations for a given occupational title are very rare).
Values are assigned to all of the possible base units by imputation from the average values of related occupations. The calculated scores for non-missing units are matched with the original data values to ensure their proportionate representation by the population, then averages calculated which show the mean scores of occupational title, group, and group-by-status units (most of these scores which are later distributed into the index files, as 'major and minor group averages'). Subsequently, values are imputed to the non-represented base units through a series of priorities, which differ by whether the base unit is title-only or title-by-status, but which try and assign whichever score is available for the nearest represented and most finely detailed occupational unit or grouping (see the construction pages for full details).
By definition, this process only effects occupational units which are relatively rare in the population, and furthermore reviews of the imputed data values suggest they provide reliable and consistent estimates. For instance, for a British data set which included occupational units which had their values imputed in this way, the strength of the associations between the derived CAMSIS scale scores and other variables were approximately equal regardless of whether all occupations, or only the non-imputed, or only the imputed, were included).
However, there are situations where this imputation style could be misleading. During CAMSIS scale constructions we have seen that in some circumstances, the first non-missing average value from which neighbouring cases are assigned imputed values, may itself be prone to being a poorly represented occupational unit. This occurs because there is a propensity for 'empty' occupational units to cluster together within the occupational schema - for example there may be a whole occupational 'minor' group where most of the occupational units are not represented by any cases. In such cases the few occupational units which are represented are often themselves sparsely represented, and so are assigned values through being merged with better represented units elsewhere; for the imputed values to be in turn based upon such merged values may seem unattractive. Nevertheless, we should emphasise that the effect of such issues is repeatedly shown to be empirically small, and therefore our current strategy can be given pragmatic support.
(Back to 'finer details' / top)
- 3) Proportion of 'excluded' cases
As is mentioned directly above, our specification of pseudo-diagonals means that some occupations are allocated scores on the basis of relatively few of the individuals used in the original sample, because many of their cases have been described as pseudo-diagonals and excluded. To reiterate, at this stage, in the country specific web pages and downloadable files available from the versions page, we have highlighted the most extreme cases, where we suggest that the more appropriate CAMSIS representation of their stratification position should should be based on information, if available, on the occupation of their spouse.
(Back to 'finer details' / top)
- 4) Scaling of values
The CAMSIS scores assigned to occupations on the downloadable index files have been scaled to cover the range 1 to 99, with a normal distribution with a mean of 50, a standard deviation of 15, and precision up to 2 decimal places. Starting from the original 'raw' occupational unit scores derived from the relevant association models, this scaling was achieved by using a normal standardisation routine on a nationally representative population distribution, then multiplying up by the appropriate values, truncating the values to the desired precision, and 'cropping' any outlying endpoints to fit within the (1.0,99.0) range. We thus maintain the ranking and distances of the original scores (with the exception of the 'cropping' procedure, which in practice usually affects few, if any, unit scores). As also mentioned in the relevant section of the construction guidelines, alternative scaling techniques could also be used. One possible critique of the normal standardisation is that it gives less influence to differentiation between occupations at the 'middle' range and greater influence to more extreme occupations; however the normal distribution closely reflects the 'raw' distribution generated by the original models, and also has several attractions in its use for subsequent analyses.
Our scaling practice has several implications. First, the scales show the relative locations assigned to occupations as related to the mean value within the relevant versions. Therefore, the mean and midpoint of 50 represents the 'average' score for the version, and the magnitude of a unit's score away from that mean may be given a substantive interpretation. Furthermore, whilst it is important to remember that each version's score values are specific to the version in which they occur, there is comparability between scores from different versions, as all represent their relative distance from the version specific average of 50. In practice, we find that this property is particularly important when analysing mixed gender populations (see also the notes above concerning the separate nature of male and female scales).
Second, again reflecting the way the scale values have been assigned through their mean statistics, we are likely to find a mean-centred, normally-distributed set of unit scores. In practice, in most examples, a national population sample (such as the one from which the values were derived) does yield an approximately normal distribution. However the scale distributions will frequently also show some examples of clustering in the distribution of scale values at certain points. The graph below, showing the distribution of male title-by-status 'ISCO' scores from the Swiss scale constructions, as also shown in the Swiss project reports, is a typical example.
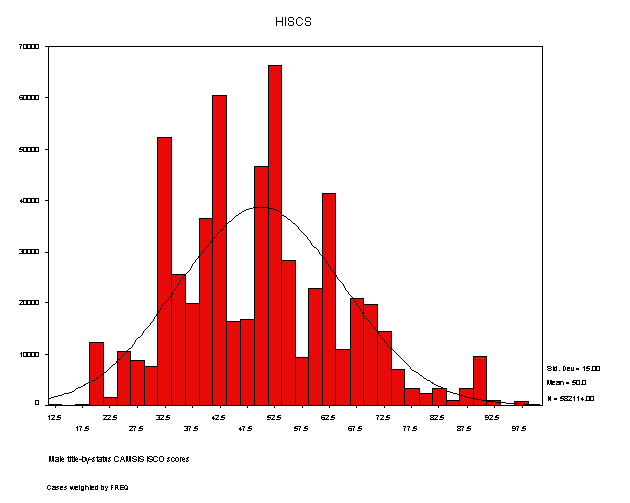
An example of this clustering is seen in the several peaks then troughs seen throughout the distribution in relation to the overlain normal curve. In fact, even more clustering is typically seen in the distribution of female occupations across CAMSIS versions. That gender trend, however, also indicates the relatively trivial source of such clustering patterns in the scale score distributions; the unexpected peaks and troughs simply indicate the influence of specific occupational units which are very common or very rare (such concentrations are a particularly marked feature in most female labour markets). If the peaks and troughs in the distributions were to coincide with discontinuities in the scale values, we may have evidence that qualitative boundaries rather than continuous gradings are better at summarising single dimensional patterns of social interaction / stratification. However, and in contradiction to this, in all the examples so far tried, we have seen that, despite limited evidence of uneven distributions of score values, the actual gradation in assigned scores between occupational units is fine and very even. (This can be checked for any specific CAMSIS version by examining the nature of the scores from the relevant downloadable index or summary files.)
A final issue concerning the scaling of values which justifies a very brief note, is to point out that the values of our derived 1-99 CAMSIS scores ultimately have an arbitrary sign. The scores reflect an order of social interaction between occupations, but there is no feature of the model estimation process that implies that high or low positive scale values have specific properties. Indeed, where across CAMSIS versions we have to date consistently generated scales which are associated with, for example, the range from greater to lesser educational credentials, at different times we have regularly seen structures where either the high positive or negative scale values are associated with the higher educational levels. For theoretical consistency, during the linear scaling process we always assign the higher scale value to occupations that can easily be shown to be the more advantaged in terms of such factors as education and income.
(Back to 'finer details' / top)
- 5) Subsidiary Dimensions
As mentioned elsewhere, when constructing CAMSIS scales using 'RC' model formulations, we have generally found it efficient to specify a limited number of 'subsidiary' dimensions, i.e. structures of dimension scores which are constrained to equality within some occupational groupings which themselves are given an a priori meaning (typical examples are subsidiary dimensions showing the employment status of an occupational unit, or the industrial sector of the unit). We do not generally emphasise, or distribute from this site, the estimated CAMSIS scale values relating to those subsidiary dimensions. However, at this stage we can note that many of the country-specific national reports available from the downloadable archives contain a discussion, and sometimes presentation, of the relevant scores. Additionally, when the scales have been constructed by the CAMSIS researchers at Cardiff, we have usually retained the relevant dimension scores in files which we have not distributed, but which we could supply to parties who express a particular interest in these issues.
(Back to 'finer details' / top)
- 6) Other explanatory factors
As also briefly mentioned in the 'critiques' section of the introductory page, an issue that concerns the CAMSIS measures, as indeed it does for all nationally-derived stratification schemes, is the strength of the interaction between social stratification structures and other overt factors. In many Western countries, for example, ethnic group and regional, stratification patterns are sufficiently strong that we do not generally expect exactly the same occupational structure of social stratification to prevail within such different segments.
At present, the only such grouping structure that the CAMSIS scales routinely take account of is that associated with gender (though we would point out that this is one more than is considered by most other stratification schemes). We currently plan to consider extensions to the CAMSIS scale derivation, which are technically possible, which consider ethnic group differences (in the USA and possibly the UK), and regional differences (if and when appropriate data becomes available). These pages will be updated as such developments progress.
In the meantime, we suggest two ways to deal with these issues. First, we recommend simply an awareness that the CAMSIS scales are derived at the level of the nation state and that analyses on heavily skewed population subgroups may be less appropriate. Second, in empirical applications it may well be possible to estimate the effects of CAMSIS scale values by testing out multiple interaction effects, between the CAMSIS values and dummy variable indicators of the putatively confounding structure(s). Such an approach may serve to illustrate whether there is indeed a substantial difference between the properties of the CAMSIS scales in the different groups.
(Back to 'finer details' / top)
- 7) The non-working population
The CAMSIS occupational scale scores have been derived only from patterns of interaction of the currently employed populations of the relevant nations, and in the first instance we would suggest that they be subsequently applied only to such populations. In ongoing work, however, we are investigating the strengths of approaches which may allow the use of CAMSIS scores for the non-working population.
First, the 'traditional' array of approaches to associating the non-working with a particular occupational unit could be employed, such as the identification of their 'last' or 'last main' job, or the assignment of the job of a household sharer.
We have also considered, during the CAMSIS scale construction process, the inclusion of categories for the non-working population, such as categorisations of labour force status (e.g. out of labour market v's unemployed) cross-classified by a categorisation of educational level (e.g. the ISCED codes). At present, we have found that such an incorporation of categories is plausible within the social interaction models used, but that, because the people involved in such categories are particularly likely to be married to or cohabiting with each other, it is apparently difficult to separate the more general location of these categories from their 'pseudo-diagonal' positions. However, work on this issue is ongoing.
(Back to 'finer details' / top)